Statistics

Home/Statistics

Getting data into R

Note: This first appeared in Biometric Bulletin Volume 33, Issue 3, Software Corner.


One of the biggest hurdles that students and novice R users have is importing data into R. A number of recent packages have made this process easier and, importantly in the age of big data, faster. Most of the packages outlined below are part of Hadley Wickham’s tidyverse and owe their speed to calling C or C++ libraries from R.

The readr package

The readr package provides new functions for importing tabular data into R. Specifically, the functions read_table()read_csv(), read_delim() are intended as fast (around 10 times faster) replacements for the base R read.table()read.csv(), read.delim(). The readr functions do not convert strings to factors by default, are able to parse dates and times and can automatically determine the data types in each column (it does this by parsing the first 1000 rows). You can even import compressed files and they will be automatically decompressed and read into R. There is also file writing functionality, with write_csv(), write_tsv() and write_delim(). If you want even more speediness in your data importing, you might also consider the fread() function from the data.table package.

The readxl package

It used to be that the most reliable way to get data from Excel into R was to save it as a tab (or comma) delimited text file. While there are alternatives, such as the xlsx, XLConnect and gdata packages, that have other features (e.g. the ability to write excel files), if all you need is an easy way to import tabular data from xls and xlsx formats files, then the readxl package is for you. Importantly it has no external dependencies, so is very straightforward to install and use on all platforms. The syntax is very similar to the readr package functions, for example you specify the file name and the sheet of interest, read_excel("spreadsheet.xlsx", sheet = "data")

The haven package

The haven package provides functions for importing from SAS, SPSS and Stata file formats, read_sas(), read_sav()and read_dta(). This functionality is similar to that available in the base R foreign package but is often faster, can read SAS7BDAT files and formats, works with Stata 14 and 14 files. Following is the code to read SAS7BDAT.

install.packages("haven")
library(haven)
dat = read_sas("path to file", "path to formats catalog")

The returned object will be a data frame where SAS variable labels are attached as an attribute to each variable. When a variable is attached to a format in SAS and the formats are stored in a library, its path also needs to be supplied. Missing values in numeric variables should be seamlessly converted. Missing values in character variables are converted to the empty string. To convert empty strings to missing values, use zap_empty(), for example,

dat$x1 = zap_empty(dat$x1)

SAS, Stata and SPSS all have the notion of a “labelled”” variable. These are similar to categorical factor variables in R, but integer, numeric and character vectors can be labelled and not every value must be associated with a label. To turn a labelled variable into a standard factor R variable use the as_factor() function,

dat$facvar = as_factor(dat$facvar)

The haven package is under active development and becoming increasingly robust. If you have difficulties loading a file, try using the development version on GitHub:

devtools::install_github("hadley/haven")

For example, consider the National Youth Tobacco Survey (NYTS) from the CDC website.  After downloading the files (and installing the development version from GitHub) the data can be imported into R using

devtools::install_github("hadley/haven")
require(haven)
x = read_sas("nyts2014_dataset.sas7bdat","nyts2014_formats.sas7bcat")
# convert qn1 to a factor:
x$qn1 = as_factor(x$qn1)
View(x)

The rio package

The rio package describes itself as “a Swiss army knife for data I/O”. It unifies many of the above methods by providing the wrapper function import() that takes as an input the path to a data file. It then uses the file extension to determine the file type and imports the data into R. The one function can be used to import standard text files, RData, JSON, Stata, SPSS, Excel, SAS, XML, Minitab and many more. There is an analogous export() function that allows users to similarly easily export data to various file types.

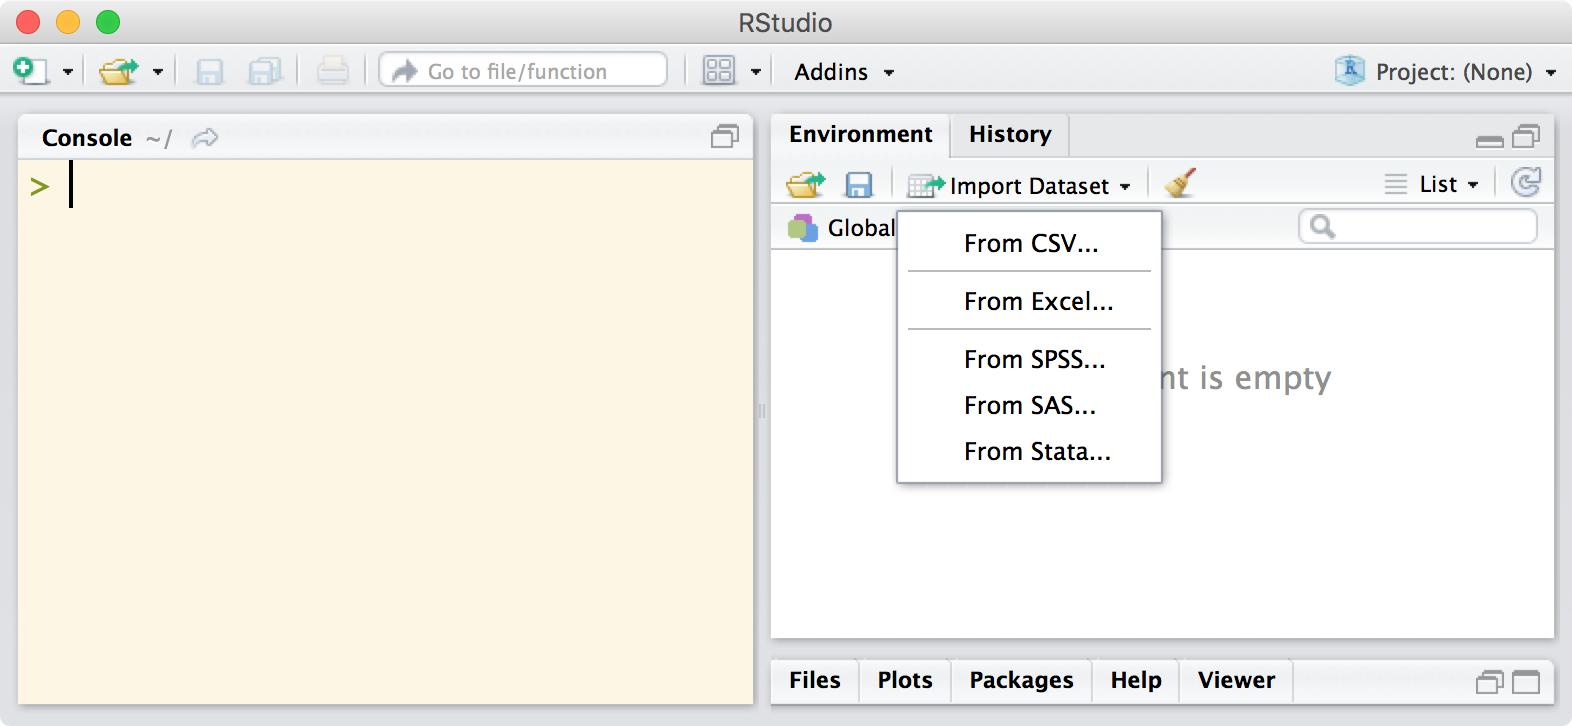
Using RStudio to import data

Recent versions of RStudio allow users to import various file types via a graphical user interface, which is perfect for novice users and experts alike as they get used to the new functions and customization options. Once you’ve clicked through the various options, it will output the required code at the console so that you can see exactly what was done to get the data in and edit the code as necessary for next time.

rio

The team at RStudio have put together a webinar on getting data into R which is well worth watching.

Once you’ve got your data into R, you’ll probably need to restructure it in some way prior to analysis. To help with this, you may want to take a look at the tidyr package provides a suite of functions to get your data set in a standardized format, such that each observation is a row, each variable is a column and there are no data in the labels.

By |2016-10-15T05:47:37+00:00October 15th, 2016|R, Statistics|2 Comments

Parallel computation in R

Note: This first appeared in Biometric Bulletin Volume 33, Issue 2, Software Corner.


Parallel computing refers to situations where calculations are carried out simultaneously, for example distributing the calculations across multiple cores of your computer’s processor, as opposed to having the calculations run sequentially on a single core. Parallel computing is particularly suitable for ‘single program, multiple data’ problems, for example in simulations and bootstrapping.

Parallel computation in R has come a long way over the last 10 years. If you tried to parallelise your R code a few years ago, you probably worked with the architecture specific snow (Windows) or multicore (Unix-like) packages. Since 2011 R has supported parallel computation as part of the base distribution with introduction of the parallel package (R version 2.14.0 released in October 2011). The parallel package builds on multicore and snow to provide a (mostly) platform agnostic method of leveraging multiple cores to speed up the computation ofembarrassingly parallel problems

This note discusses how incorporate parallel and associated packages, with little or no additional effort on the part of the statistical practitioner, to speed up data processing and statistical analysis pipelines.

Getting started

The parallel package is part of base R which means that it’s already installed and you can’t find it on CRAN. You can load it in the usual way library("parallel"). The first thing you’ll want to do is detectCores() which checks how many cores you have available wherever R is running (probably your laptop or desktop computer).

Parallel apply

The family of apply functions (apply, lapply, tapply, sapply, etc.) in R provide an extremely convenient way of applying a function to the margins of an array, matrix, list, etc. If you’re using apply on a data frame, e.g. apply(X,2,median) to compute the median of the columns of X, you should consider using lapply instead because it’s much faster, e.g. lapply(X,median) which computes the median of each variable in the data frame X (there’s no need for a margin argument).

The apply functions operate serially, i.e. they calculate each value in sequence and are constrained to use only one of your computer’s cores. If you’re on a Unix-like system, the mclapply function is an easy way to distribute the computation across the available cores. To use mclapply, first code your calculations as a function that can be called with lapply. Make sure it works serially using lapply and then use mclapply to perform the computations in parallel.

library("parallel")
X <- data.frame(matrix(rnorm(1e+07), ncol = 200))
mclapply(X, median)

In this simple example, there is only a relatively minor speed improvement. To get the most out of parallel processes, the functions to be run in parallel should be non-trivial. There is an overhead associated with forking the process, so it is possible to slow your code down with mclapply if the time taken to send the tasks out to various cores takes longer than performing the task serially.

Windows can’t “fork” processes in the same way that Unix-like systems do. This means that you won’t see any improvements in speed when using mclapply on a Windows machine. On the plus side, your code won’t break – it will work as if you were simply using lapply. Microsoft has announced plans to incorporate a Ubuntu image into future releases of Windows 10 through a new infrastructure they’re calling “Windows Subsystem for Linux”. This means you may soon be able to run R in a native Unix-like environment (which supports forking and hencemclapply) on Windows 10 machines.

Parallel loops

An alternative to mclapply is the foreach function which is a little more involved, but works on Windows and Unix-like systems, and allows you to use a loop structure rather than an apply structure. To use foreach you need to register a “parallel backend”, for example using thedoParallel package. The doParallel package acts as an interface between foreach and the parallel package. A simple example of how this works is given below where we calculate a percentile bootstrap confidence interval for a least absolute deviations (LAD) regression parameter. In the code below, we resample a dataset 10,000 times and each time generate LAD regression coefficients.

library("quantreg") # for quantile regression function rq()
data(engel) # the data set we'll use
# help(engel) 
# plot(foodexp ~ income, data = engel)
# fit1 <- rq(foodexp ~ income, tau = 0.5, data = engel)
# abline(fit1)
library("foreach")
library("doParallel")
cl <- makeCluster(2) # create a cluster with 2 cores
registerDoParallel(cl) # register the cluster
res = foreach(i = 1:10000, 
              .combine = "rbind", 
              .packages = "quantreg") %dopar% {
  # generate a bootstrap sample              
  boot_dat <- engel
[sample(1:nrow(engel), replace = TRUE), ] # fit the model fit1 <- rq(foodexp ~ income, tau = 0.5, data = boot_dat) # return the coefficients fit1$coef } stopCluster(cl) # shut down the cluster

In the foreach() function we’ve specified that the results should be combined using rbind (i.e. the rows will be bound together, where the iththrow is the LAD regression coefficients from the ithth bootstrap sample) and we’ve indicated that the quantreg package needs to be loaded on each of the processes. The output is a matrix, that we’ve called res, which consists of two columns and 10,000 rows. We obtain a 95% percentile bootstrap by extracting the appropriate quantiles:

resdf <- as.data.frame(res)
quantile(resdf$income, probs = c(0.025,0.975), type = 1)
##      2.5%     97.5% 
## 0.4704510 0.6125974

The for loop syntax is very similar to a regular for loop in R, except it starts with foreach and uses the %dopar% function. If you use %do% instead of %dopar% evaluates the loop sequentially where one CPU will run at 100% until the job is finished. In the above example we asked for two cores to be used, hence with %dopar% both cores will run at 100% until the job is done. This means that a %dopar% loop running on two cores will finish in roughly half the time that it would have taken to run on a single core. As an example, the code above with 100,000 replications using%do% takes 3.0 minutes on my computer whereas using %dopar% takes only 1.6 minutes. It’s not exactly two times faster because of the computational overheads involved in sending the tasks out to the different cores and collating the results. For more details see the doParalleland foreach vignettes.

Distributed computing

The function mclapply can only use the cores of one machine, i.e. jobs can’t be distributed over several nodes of compute cluster. One way to do this in R is to use the parLapply function which can utilise the Message Passing Interface (MPI) system. For further details see the Rmpi package. The doMPI package provides an MPI parallel backend for the foreach package.

Other considerations

Parallel random number generation: When bootstrapping or performing simulation studies, it is desirable for each instance of R to generate independent, reproducible pseudo-random numbers. If there is an object .Random.seed in your R workspace that is then shared with the worker cores, all your instances of R may inavertently run identical simulations using identical “random” numbers. Alternatively, if .Random.seed is not in the workspace, then you will have independent streams of random numbers but it will not be reproducible. The parallel package includes a random number generator designed to overcome these issues. It can be enabled using RNGkind("L'Ecuyer-CMRG"). See the documentation of the parallel package for details.

Multi-threaded linear algebra computation: R can also be compiled against multi-threaded linear algebra libraries (BLAS, LAPACK) which can speed up calculations. One of the easiest ways to do this is to install Microsoft R Open (formerly known as Revolution R Open), however doing so ties you to a CRAN snapshot taken at a fixed point in time. You can still install the most up-to-date version of a package by manually specifying the repos argument.

Bioconductor: If you work with Bioconductor packages, you should look into BiocParallel which provides modified versions of functions optimised for parallel evaluation, tailored for use with Bioconductor objects.

So the next time you think about leaving a simulation running on your computer for the weekend, consider using mclapply instead of lapply or rewriting that for loop as a foreach loop and have it run overnight instead, or send it out to a supercomputer and have the results within a couple of hours!

By |2016-10-15T05:47:42+00:00July 5th, 2016|R, Statistics|1 Comment

Workshop: Data visualisation, interactive data analysis, statistical programming

On Friday I gave a workshop at BioInfoSummer 2015 at the University of Sydney.  It was very well received, so I’m sharing the resources I developed more broadly.

Title

Data visualisation, interactive data analysis, statistical programming

Link

garthtarr.github.io/visR

Outline

In recent years, the power of R has been unleashed through the Shiny package which enables users to interact with complex analyses without needing to know any R programming. A Shiny application is a web interface to an underlying R instance. It is remarkably easy to develop both simple and complex Shiny apps using R and importantly, it requires no special knowledge of HTML, CSS or JavaScript. This workshop outlines the basics of developing a Shiny app and showcases some more advanced examples. One of the advantages of moving to a web-based approach is that it enables richer interactivity in data visualisation. There is a large, and ever increasing, pool of R packages that allow researchers to go beyond static plots.

As part of this workshop we will introduce the htmlwidgets framework that joins the raw statistical power of R with beautiful visualisations powered by JavaScript. The networkD3 and edgebundleR packages will be highlighted as examples that enable interactive visualisations of networks. It can be a full time job keeping up with all the new features R has to offer statisticians and bioinformaticians – the aim of this workshop is to familiarise you with some of the latest and greatest tools available for data visualisation and interactive data analysis.

Feedback

By |2016-10-15T05:47:43+00:00December 12th, 2015|Statistics|Comments Off on Workshop: Data visualisation, interactive data analysis, statistical programming

Year 12 maths enrollment trends

Looking at the last 10 years (2004-2014), intermediate and advanced mathematics has lost ground, though you could argue that things have stabilised in the last few years.  The big problem is that we’d already lost a significant proportion of advanced maths students from 1995-2004.  Stabilisation of student numbers in advanced and intermediate maths is good, but it’s not enough.  We need to motivate a larger proportion of high school students to deepen their mathematical skill set by taking higher level mathematics units.

Reinstating compulsory (rather than assumed) levels of mathematics in first year university would go part way to addressing this problem.

If we succeeded in having a greater proportion of high school students taking higher level mathematics, I suspect the issue would be that we would need more trained, competent, specialised high school mathematics teachers to meet the demand.

References:

  1. Year 12 Mathematics Student Numbers 1995-2010
  2. Participation in Year 12 mathematics across Australia 1995-2004
  3. Participation in Year 12 mathematics 2004 – 2014
By |2016-10-15T05:47:43+00:00October 21st, 2015|Statistics|Comments Off on Year 12 maths enrollment trends

Network diagram: USYD statistics department

I recently customised the forceNetwork() function from the networkD3 R package to generate this interactive network diagram of the University of Sydney statistics department.

By |2015-07-15T23:50:44+00:00July 15th, 2015|Statistics|Comments Off on Network diagram: USYD statistics department

Jitter (box)plot

I’ve been making a bit of an effort lately to participate in sites like Cross Validated and Stack Exchange.  One post that came up recently asked an interesting question before it was declared off topic and closed.

Basically they wanted to reproduce Figure 3c from this paper.

This is what I came up with (before realising the question was closed):

You could have a look at

[this](http://stackoverflow.com/questions/22074164/scatter-plot-and-boxplot-overlay) post or I’ve implemented something similar to Figure 3c using base graphics below.


# generate some random data
mu = c(1,3,2,2)
n = 8
grp = factor(rep(letters[1:4],each=n))
data = rnorm(n*4, sd = 1) + rep(mu,n)

# use the boxplot function to scaffold the plot window
boxplot(data~grp,staplewex=0,outwex=0,boxwex = 0,outline=FALSE,
ylim=c(min(data),max(data)),border = "white")

# add the observations to the plot
pos = jitter(as.numeric(grp))
points(pos,data)

# add the horizontal line function
add.lines = function(data,grp,FUN=median,const=0.25){
mid = aggregate(x=data,by=list(grp),FUN)
lb = unique(as.numeric(grp))
segs = cbind(lb-const,mid$x,lb+const,mid$x)
for(i in 1:dim(segs)[1]){
segments(segs[i,1],segs[i,2],segs[i,3],segs[i,4],lwd=2)
}
}
add.lines(data=data,grp=grp)

Which gives the following:

Rplot

By |2016-10-15T05:47:43+00:00May 6th, 2015|Statistics|Comments Off on Jitter (box)plot

Robust Statistics

Here’s a video I put together as part of a job application process discussing the concept of robustness and highlighting the aim of robust estimators.

The slides are here: https://garthtarr.com/pres/RobIntro

Note that you may need to refresh the slides to get the network graphs to appear.

References:

Location: Hodges-Lehmann estimator
http://en.wikipedia.org/wiki/Hodges-Lehmann_estimator
Hodges, Lehmann (1963). Estimation of location based on ranks. Annals of Mathematical Statistics 34(2): 598-611. DOI: 10.1214/aoms/1177704172

Covariance: Minimum Covariance Determinant (MCD) estimator
Hubert, Debruyne (2010). Minimum covariance determinant. Wiley Interdisciplinary Reviews: Computational Statistics, 2: 36-43. DOI: 10.1002/wics.61

Sparse precision matrix estimation: Graphical lasso
Friedman, Hastie, Tibshirani (2008). Sparse inverse covariance estimation with the graphical lasso. Biostatistics, 9(3): 432-441. DOI: 10.1093/biostatistics/kxm045

Robust precision matrix estimation
Tarr, Müller, Weber (2015). Robust estimation of precision matrices under cellwise contamination. Computational Statistics & Data Analysis, to appear. DOI: 10.1016/j.csda.2015.02.005

Robust scale estimation
Tarr, Müller, Weber (2012). A robust scale estimator based on pairwise means. Journal of Nonparametric Statistics, 24(1): 187-199. DOI: 10.1080/10485252.2011.621424

Overview of robust estimation of scale and dependence
Tarr, (2014). Quantile Based Estimation of Scale and Dependence. PhD Thesis. University of Sydney, Australia. hdl.handle.net/2123/10590

By |2016-10-15T05:47:43+00:00March 5th, 2015|Statistics|Comments Off on Robust Statistics

Parallel processing in R

I’ve tried a few different approaches for parallel processing in R but the function I’ve found easiest to use is foreach. The only trick is that you need to register a “parallel backend” – doMC works well for unix systems (including OS X).

Specifying the .combine argument allows you to customise how the results are aggregated at the end of the loop.

Simple example:

require(doMC)
require(foreach)
registerDoMC(cores=3)
n=10
result = foreach(j = 1:n, .combine=rbind) %dopar% {
  # EXPERIMENT
  # last line is returned as a row in the result matrix
  rep(j,4)
}

The output:

result
          [,1] [,2] [,3] [,4]
result.1     1    1    1    1
result.2     2    2    2    2
result.3     3    3    3    3
result.4     4    4    4    4
result.5     5    5    5    5
result.6     6    6    6    6
result.7     7    7    7    7
result.8     8    8    8    8
result.9     9    9    9    9
result.10   10   10   10   10
By |2014-09-26T04:47:56+00:00September 26th, 2014|Statistics|Comments Off on Parallel processing in R

Talk to new PhD students

Today I was asked to give a talk to new research students in the School of Maths and Stats about my experiences. Here’s what I prepared:

I’m going to talk about three things:

1) daily struggle of being a PhD student
2) not overloading yourself with non-PhD related commitments
3) conferences

1) Throughout undergraduate life you tend to be successful pretty regularly. Your work is doled out in bite sized pieces, you get positive reinforcement from doing well in an assignment/quiz/exam. At the end of the semester you got a set of marks, probably Ds or HDs, to let you know that you are on track.

As a postgraduate student that doesn’t really happen. You’re not going to be successful on a daily basis. There’s a good chance you won’t even be successful on a monthly basis. There will be a time when you question your life choices – where you wonder why on earth you chose this path. For weeks on end you might find yourself banging your head against a wall.

And just when you’re about to throw in the towel and give up,
– a spark of an idea will come to you,
– or you’ll find a journal article that gives you a new perspective on how to solve the problem,
– or you’ll find new meaning in an old article that was utter gibberish when you first read it a few months ago
and you’ll get a little jolt of ecstasy as that Gordian knot of a problem you’ve been working on unravels before you.

Those are the good days – you’ll get a rush of endorphins as a present to you from your body for a job well done and you’ll take the afternoon off and go home with a smile on your face. You will remember those days – they are what gets you through the leaner times as you set your mind to the next problem and once again start the daily slog to the next watering hole.

I don’t think there’s any way to avoid the slog, your supervisors might be able to give you some directions to help you navigate the wastelands, but they don’t have a complete map either and there’s no guarantee that they’ve pointed you in a fruitful direction.

Research takes time. Which brings me to my second point.

2) It helps to have a lot of time to devote to research. This may mean limiting your extracurricular activities when they take too much time out of your regular research day. For me, I did way too much teaching early on in my degree – as I was teaching here and in the Business School. I wouldn’t go so far as to say that I regret doing all the teaching – I enjoyed it – but it definitely slowed down my progress. For other people it’s trying to do a PhD full-time while working a couple of days a week elsewhere – they almost invariably find that one or both suffers as a result.

If you like teaching, you can apply to become a postgraduate teaching fellow – applications usually open up at the end of the year – it gives you a fancy title, a regular pay cheque, the possibility of a bit of lecturing, and it doesn’t overload you with too much work.

Life is also more enjoyable when you don’t overload yourself. When I had time, one of the high points of my day was taking a paper and a highlighter down to the benches between Carslaw and Madsen, sitting out there in the sun reading, highlighting and contemplating. Just thinking about stuff.

The final thing I want to talk about is going to conferences.

3) I’ve had the opportunity to go to a number of domestic and international conferences, both specialised conferences with around 100 people and larger more general conferences. As soon as you have something to talk about, I’d suggest going to a specialised conference – this probably means you have to (get to) travel overseas.

I went to a specialised conference about 18 months into my degree. It was ICORS in Spain and I had an awesome time.

I didn’t really appreciate how important it was for my development at the time – but looking back now I think it was pretty important:
– EXPOSURE I was exposed to a heap of different ideas, while not directly relevant, they did give me a broader understanding of all the different areas in my field which made reading articles easier.
– NETWORKING I met a lot of people, so when I went back a couple of years later, I already knew people there or knew their colleagues, feel like you’re a part of a larger community. Also putting names to faces on journal articles makes them more interesting – especially if it’s tied to a fond memory of a tapas bar crawl or 3am beers in the bar of a Russian hotel.
– FEEDBACK And perhaps most importantly, it forces you to write-up your ideas and present them to a potentially critical audience so you can get some feedback (other than relying on your supervisors)

There are lots of funding opportunities if you know where to look,
– PRSS (postgraduate research support scheme)
– your research group usually has a bit of money for conference travel
– there are additional scholarships occasionally advertised on scnews (the School’s electronic notice board)
– professional bodies such as SSAI or AustMS sometimes have opportunities too – to take advantage of these you usually need to have been a member for at least a year. It’s $20 a year for SSAI and student membership of AustMS is free.

Other bits and pieces (that could have been points I talked about):
– get to know your fellow PhD students – you’re all in it together, experiencing the same highs and lows. The stats group have a weekly coffee event, not sure about the maths people.
– meet with your supervisors regularly even if you think you haven’t made much progress. I often find I make more progress in the hour or two before meeting with my supervisors than in the whole rest of the week!
– treat it like a 9-5 job so that you know you’re spending enough time on it.
– start writing early.

phd051412s

By |2016-10-15T05:47:43+00:00March 10th, 2014|Statistics|Comments Off on Talk to new PhD students

Stats jobs for undergraduates

Update December 2015: I’ve made a new page dedicated to the various kinds of jobs people with statistical training can apply for (including job descriptions). Check it out here: garthtarr.com/jobs-for-statisticians

I regularly get asked for advice about what undergraduate stats majors can do after their degree (particularly if they don’t want to end up in a bank or consulting company). The standard response is that statisticians can do anything, but if you want to use your stats skills specifically, here are some resources:

Government

Lots of government departments take undergraduate and honours level statisticians, not just the ABS but also ATO, DEEWR, Defence (and specifically DSTO), ABARES, RBA, Treasury, Bureau of Crime Statistics & ResearchStatistics NZ … keep an eye out early in the year for grad programs. Also look into summer internships (e.g. ABS cadetships; RBA cadetships and the ABARES Summer Vacation program).

You could always become a teacher – not enough maths teachers at the high school level (or at the primary school level).  See, for example, the Teach for Australia program.

Private sector

Most (if not all) companies will appreciate a person with solid quantitative skills.  You could consider (to name just a few):

Within banks there are ways to use your statistics without doing financial work or trading.  For example the ANZ Bank has the Central Customer Analytics department and NAB has its Analytics and Research Operations department.

Further study

If you want to specialise further in statistics (without doing a PhD) you might consider a Masters in Statistics or Biostatistics. For example, UNSW has a decent Master of Statistics and the  School of Public Health here at the University of Sydney has a Master of Biostatistics.  There’s a program with NSW Health called NSW Biostatistical Officer Training Program which recruitments trainee biostatisticians every year (applications are usually due in November). While in the program, trainees work full-time in a variety of placements and undertake a Masters of Biostatistics part-time. NSW Health pays university and associated fees and study leave is given.  See also this blog post by Jerzy Wieczorek, mathematical statistician at the U.S. Census Bureau for some thoughts on Masters.

Job listings

You might want to subscribe to the ANZstat mailing list (make sure you set up a filter in your email program of choice so your inbox doesn’t get innundated with messages).  The jobs on this mailing list are often for people with a PhD but not always (for example, those NSW Health trainee biostats jobs get advertised on this mailing list).

There’s also the StatSci joblist and a page with more general information.

The Australian Mathematical Society (Aust MS) has a page on jobs for people with quantitative skills.

Sport statistics jobs

  1. Keep an eye on StatsJobs for potential openings. These are likely to be mostly higher level stats jobs (e.g. requiring a masters or higher) but there may be grad level positions. You could also keep an eye on the Sports Management Australia and New Zealand site.
  2. Go for positions in sports companies/relevant government agencies without a focus on stats, then (after a period of time) transfer into a more stats based job (if you go for a government job, they’re often really good about supporting further study, e.g. masters in stats). E.g. Department of Sports and Recreation 
  3. If you’re planning on heading overseas, the Royal Statistics Society (UK based organisation) has a Statistics in Sport section or the American Statistical Association have this advice. Unfortunately, there’s no equivalent in the Statistical Society of Australia Inc (SSAI).
  4. You could also look at companies like atass sports (UK based) or Statistical Sports Consulting (USA based). A dedicated stats company like this would give you the extra training in the appropriate areas that you’d need. But there doesn’t seem to be anything comparable in Australia (that I’ve been able to find). The next best would be to look for jobs with the Australian Institute of Sport, AFL, NRL, etc. directly.

City jobs

Most people know about the standard jobs in the city: investment banking, derivatives trading, management consulting, human resource consulting, other forms of consulting, … Those companies do a good job of getting the word out on campus about internships and grad positions.

By |2016-10-15T05:47:46+00:00August 28th, 2013|Statistics, Teaching|Comments Off on Stats jobs for undergraduates
Go to Top