I’ve been making a bit of an effort lately to participate in sites like Cross Validated and Stack Exchange. One post that came up recently asked an interesting question before it was declared off topic and closed.
Basically they wanted to reproduce Figure 3c from this paper.
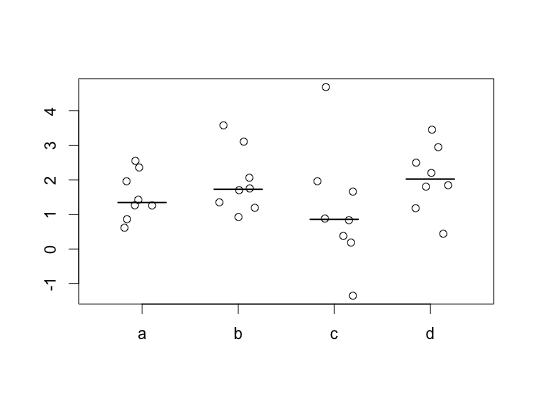
This is what I came up with (before realising the question was closed):
You could have a look at
# generate some random data

mu = c(1,3,2,2)

n = 8

grp = factor(rep(letters[1:4],each=n))

data = rnorm(n*4, sd = 1) + rep(mu,n)
# use the boxplot function to scaffold the plot window
boxplot(data~grp,staplewex=0,outwex=0,boxwex = 0,outline=FALSE,
ylim=c(min(data),max(data)),border = "white")
# add the observations to the plot
pos = jitter(as.numeric(grp))
points(pos,data)
# add the horizontal line function
add.lines = function(data,grp,FUN=median,const=0.25){
mid = aggregate(x=data,by=list(grp),FUN)
lb = unique(as.numeric(grp))
segs = cbind(lb-const,mid$x,lb+const,mid$x)
for(i in 1:dim(segs)[1]){
segments(segs[i,1],segs[i,2],segs[i,3],segs[i,4],lwd=2)
}
}
add.lines(data=data,grp=grp)
Which gives the following: